
Research
Ultra Processed Food Research
Original data analysis based on our database of 448,423 food products. Explore processing patterns, ingredient trends, and brand comparisons across major food categories.
Flagship Analysis
Our most comprehensive report, a full analysis of ultra-processing across the entire U.S. food supply.
Comprehensive ReportWe Analyzed 448,423 Food Products
The most comprehensive analysis of ultra-processing in the US food supply. Processing levels, ingredient patterns, brand rankings, and category breakdowns from our full database.
448,423
Products analyzed
27.8%
Ultra-processed
25,230
Brands covered
358
Categories analyzed
Category Deep Dives
Focused analyses of processing levels within specific food categories. Each brief includes processing distributions, top ingredients, brand comparisons, and category-specific insights.
Breakfast Cereals
Data-driven analysis of ultra-processing levels in breakfast cereals. See which cereals are ultra-processed, the most common additives, and how brands compare.
Read guideCandy
How ultra-processed is candy? We analyzed 20,000+ candy products to reveal processing levels, the most common additives, and brand comparisons.
Read guideIce Cream
How processed is your ice cream? Analysis of 13,000+ ice cream products reveals processing levels, common additives, and which brands rank best.
Read guideBread
Is your bread ultra-processed? We analyzed 10,000+ bread products to reveal which breads are truly simple and which contain dozens of industrial additives.
Read guideCookies & Crackers
How ultra-processed are cookies and crackers? Analysis of 12,000+ products reveals processing levels, common additives, and brand comparisons.
Read guideFrozen Dinners & Entrees
Are frozen dinners ultra-processed? We analyzed 5,000+ frozen meals to reveal processing levels, the most common additives, and which brands rank best.
Read guideSoda
How ultra-processed is soda? Analysis of 6,000+ soda products reveals processing levels, common additives, ingredient patterns, and brand comparisons.
Read guideAbout Our Research
All research on this site is based on our proprietary analysis of branded-product data from USDA FoodData Central and Open Food Facts. We start from over 2 million raw records and, after de-duplicating UPC variants and filtering to products with complete data, analyze 448,423 canonical products.
Products are scored using our two-score system: a Processing Score (based on ingredient analysis) and a Nutrition Score (0-10, based on nutrient profile). For full details, see our methodology.
Related Resources
Deepen your understanding of ultra-processed food with these guides.
Ketzal for iPhone
Check What's Already In Your Kitchen.
Scan a barcode, on the shelf or in your pantry, and see both scores in seconds. Free, no account needed.
Scan It Free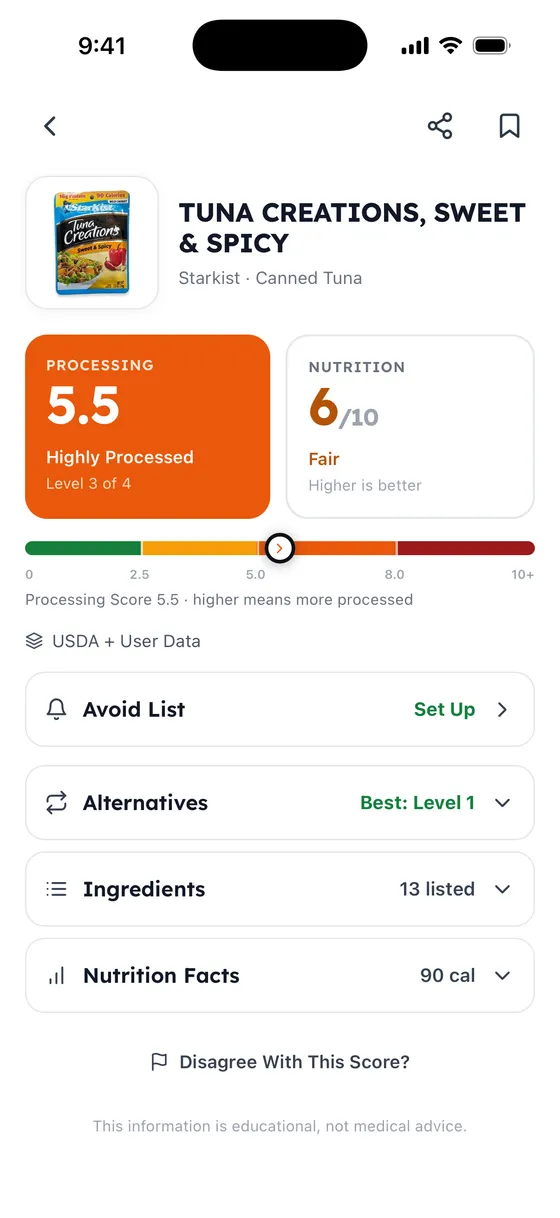
About our scores and this content
Processing and Nutrition Scores reflect the ingredient lists and nutrient data we observe; they are our analysis, not absolute measures of health. Read the full methodology. This information is provided for general nutrition education and is not medical, health, or dietary advice. Product formulations change often, so check the actual label before purchasing, and consult a registered dietitian or your physician for personal guidance.