
Nutrition Excellence by the Numbers
4,279
Perfect Scores
Products with perfect 10.0 nutrition scores across all categories
10,683
Excellent Nutrition
Products scoring 9.0 or better on nutrition
What Makes a Nutrition Champion
- Protein and fiber together: every product in the tables below carries both, rather than one at the expense of the other
- Little or no added sugar: none of them lean on sugar, while 26.5% of the catalog carries a high-sugar flag
- Rare company: a perfect 10.0 is 1.1% of everything we score, and 9.0 or better is 1.6%
Perfect 10.0 Nutrition Score Champions
These products reach the highest possible nutrition score on protein, fiber and nutrient density, with no added sugars:
Perfect 10.0 nutrition score champions
Perfect Score Insight: These products achieve 10.0 nutrition scores through exceptional nutrient density, high protein and fiber content, and zero added sugars. Most maintain minimal processing scores (PS ≤ 2.0).
High Protein Champions
Exceptional protein sources combining high nutrition scores (7.0+) with reasonable processing:
High protein champions
High Fiber Stars
The highest fiber content in the catalog, led by an unsweetened cocoa powder and a ground flaxseed:
High fiber stars
Category Nutrition Leaders
A top nutrition performer from each major food category:
Top nutrition performer by category
Unexpected Nutrition Gems
High-nutrition products in categories that are typically more processed:
Unexpected nutrition gems in processed categories
Hidden Gem Strategy: Don't write off entire categories. Even in candy and snacks, nutrition-conscious brands are creating products with exceptional nutrient profiles and minimal processing.
Shopping for Nutrition Excellence
What to Look For
- Protein above 10g per serving. Uncommon on a packaged label, and it ranks a product near the top of its category on nutrition
- Fiber above 6g per serving. Rarer still, and it lifts a product above almost everything else in the aisle
- Added sugars at 5g or below. Sugar is what pulls most of the catalog down: 26.5% of products carry a high-sugar flag
- Short ingredient lists. A short list ranks low on processing. The typical product declares 15.2 ingredients
Red Flags to Watch For
- Sodium above 400mg. Ranks a product down on nutrition, and 21.6% of the catalog is flagged high-sodium
- Trans fats or hydrogenated oils. Lowers the Nutrition Score, and hydrogenated oil in the ingredient list raises the Processing Score at the same time
- Named preservatives. Each named preservative counts separately, so a label carrying several ranks well above one carrying none
- High fructose corn syrup. One of the clearest single markers of industrial processing on an ingredient list
Understanding Nutrition Scores
The Nutrition Score runs from 0 to 10 and reads seven amounts off the Nutrition Facts panel: protein, dietary fiber, added sugars, sodium, saturated fat, trans fat and cholesterol. Protein and fiber raise it. The other five lower it.
Those seven amounts are the whole of it. The score does not read amino acid composition, omega-3s, vitamins, minerals or fermentation, and it measures no effect in the body.
How to Tell a Strong Score From a Weak One
The number is a ranking, so it means something only against the rest of the catalog. The average across the 389,334 products carrying a Nutrition Score is 4.4. Here is where all of them land:
- Perfect (10.0): 4,279 products, 1.1% of everything we score
- Excellent (9.0-9.9): 6,404 products, 1.6% of everything we score
- Good (7.0-8.9): 44,271 products, 11.4% of everything we score
- Average (5.0-6.9): 126,490 products, 32.5% of everything we score
- Below Average (4.0-4.9): 54,310 products, 13.9% of everything we score
- Poor (0.0-3.9): 153,580 products, 39.4% of everything we score
Read that top to bottom and the shape of a strong score is plain. Anything at 9.0 or better is in the top few percent of the catalog, and a product at 7.0 has already cleared most of what is on a shelf. Below 4.0 sits the largest band of all, which is the part of this that surprises people.
The products in the tables above are not exotic. Soy and pumpkin seed protein, ground hemp, red lentil pasta, kidney beans, quinoa, rolled oats, cocoa powder. Nearly all of them are whole foods with one or two ingredients, which is why they rank at the top on both scores at once.
Ketzal for iPhone
Find The Swap For What You Already Buy.
Scan a product you use and Ketzal suggests less processed options from the same category.
Find My Swap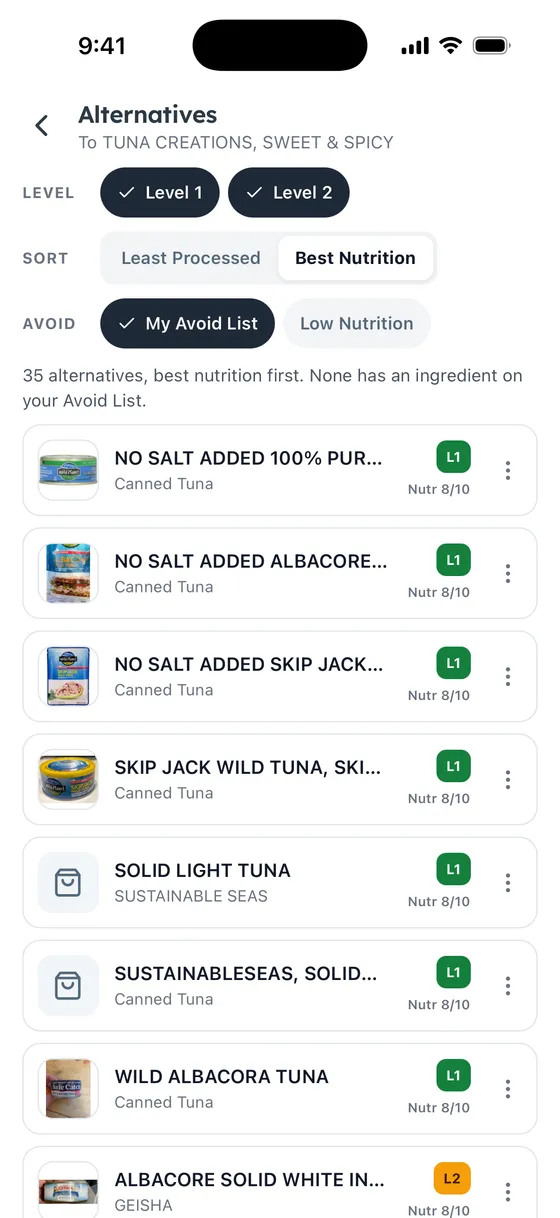
Key Nutrition Champion Insights
- Perfect scores exist across categories: From frozen vegetables to protein powders, 4,279 products achieve maximum nutrition scores through exceptional nutrient density.
- Protein champions come in many forms: Traditional sources like beans and modern alternatives like hemp and seed proteins all sit in the top nutrition band, alongside a lentil pasta and a jar of nutritional yeast.
- Fiber travels with protein: the products in the fiber table above carry both.
- Hidden gems prove options exist everywhere: Even in processed categories like candy, innovative brands create products with exceptional nutrition profiles and minimal processing.