
Why Thresholds Matter
With 445K+ products in our database, finding the options that fit your limits can be overwhelming. Score thresholds act as your personal filter, automatically eliminating products that don't meet your standards while highlighting those that do.
The Power of Dual Thresholds
Using both PS and NS thresholds together prevents common shopping mistakes:
- PS limit alone: Might include minimally processed products with a low nutrition score, such as pure sugar
- NS limit alone: Might include ultra-processed “health” foods
- Both together: Finds products that score well on both scales
29.1%
Green (PS ≤ 3)
112,790 products
28.6%
Yellow (PS 3-6)
110,774 products
42.3%
Red (PS > 6)
163,698 products
Recommended Thresholds by Goal
Each list below holds real products that meet the goal's two limits and that a stricter goal on this page does not, so the four lists show four different kinds of shopping rather than four copies of the same shelf.
Strictest Limits
PS ≤ 4.0 · NS ≥ 6.5
The strictest processing limit on this page, paired with a high Nutrition Score floor. 43,603 products in our database clear both limits.
Shopping List Examples:
- 100% Whole Grain Old Fashioned Oats (Great Value, Breakfast Cereal) PS 1.0NS 10.0
- Sprouted Mung Beans (Truroots, Pre-Packaged Fruit & Vegetables) PS 1.0NS 10.0
- Cocoa Powder (365 Everyday Value, Baking Additives & Extracts) PS 1.0NS 10.0
- 100% Whole Wheat Macaroni Product, Penne Rigate (Food Club, Pasta by Shape & Type) PS 1.0NS 10.0
Loosest Limits
PS ≤ 6.5 · NS ≥ 5.0
The lowest Nutrition Score floor on this page, with a moderate processing limit. It admits products the three stricter pairs leave out. 133,448 products in our database clear both limits.
Shopping List Examples:
- Peanut Butter (Best Yet, Nut & Seed Butters) PS 5.3NS 6.5
- Mackerel in Tomato Sauce (Geisha, Canned Seafood) PS 5.3NS 6.5
- Meatballs, Turkey (Rosina, Frozen Bacon, Sausages & Ribs) PS 5.3NS 6.5
- Original Premium White Chicken (Great Value, Canned Meat) PS 5.3NS 6.5
Highest Nutrition Floor
PS ≤ 8.0 · NS ≥ 7.0
The highest Nutrition Score floor on this page, with the loosest processing limit. Protein powders and recovery products sit here. 48,975 products in our database clear both limits.
Shopping List Examples:
- Sydney Blend Gluten-Free Cake Flour (Blends by Orly, Flours & Corn Meal) PS 4.5NS 10.0
- Original Organic Superfood Oatmeal (Purely Elizabeth., Breakfast Cereal) PS 4.5NS 10.0
- Red Lentils +10 Superfoods Pasta, Ziti (Bentilia, Pasta by Shape & Type) PS 5.0NS 10.0
- Pasta, Loopdy-Loos Cavatappi (Goodles, Pasta Dinners) PS 5.0NS 10.0
Balanced Limits
PS ≤ 5.0 · NS ≥ 5.5
A moderate processing limit with a Nutrition Score floor above the catalog average of 4.4. Store brands and national brands are scored on the same ingredient lists, so both appear here; our shopping guide covers each store. 77,032 products in our database clear both limits.
Shopping List Examples:
- Peanut Butter (Skippy, Nut & Seed Butters) PS 4.5NS 6.5
- Campfire Baked Beans (365 Whole Foods Market, Canned & Bottled Beans) PS 4.5NS 6.5
- Grilled Chicken Breast Strips with Rib Meat (Simply Balanced, Frozen Appetizers & Hors D'oeuvres) PS 4.5NS 6.5
- Cultured Chickpeas and Hemp Seeds (Hempe, Other Meats) PS 4.5NS 6.5
Adjust by Food Category
Different food categories have different baseline processing levels. Adjust your thresholds accordingly to find the best options within each category.
“Good” below is measured inside each category rather than across the whole database: Good PS is the score that only the least processed quarter of that category beats, and Good NS the score only its best-nourishing quarter beats. Hit both and the product is in the better quarter of its own aisle on each axis.
Average and target processing and nutrition scores by category
Pro Tip: In the higher-processing categories at the bottom of that table, focus more on NS to find the better options, since most of what is on the shelf will exceed a strict PS threshold.
Smart Shopping Strategies
The Perimeter Strategy
Shop the store perimeter first where fresh, minimally processed foods live:
Perimeter (Avg PS: 4.4)
- Produce
- Protein & Meat
- Dairy
Center Aisles (Avg PS: 8.4)
- Snacks & Candy
- Bakery
- Prepared Meals
- Breakfast
Both averages are taken over the categories listed under them, so what the number covers is what you can see. Packaged bakery sits in the second list rather than the first: our database holds shelf-stable bakery products, not a fresh bakery counter.
The Label Quick Check
Before checking our app, use these quick indicators to estimate scores:
Signs of High PS:
- 15+ ingredients
- Words you can't pronounce
- Multiple preservatives
- “Natural flavors” listed
- Modified/hydrogenated anything
Signs of Good NS:
- Protein ≥ 5g per serving
- Fiber ≥ 3g per serving
- Added sugar < 5g
- Sodium < 200mg
- Short ingredient list
The Swap Strategy
Common swaps that dramatically improve your scores:
Common swaps
Try It Yourself
Ready to put thresholds into practice? Use our search to filter products by Processing Score and Nutrition Score: Search Products by Score.
Ketzal for iPhone
Let Ketzal Read The Label For You.
Add your allergens to your Avoid List and Ketzal flags them whenever an ingredient list names them. Free with an account.
Set Up My Avoid List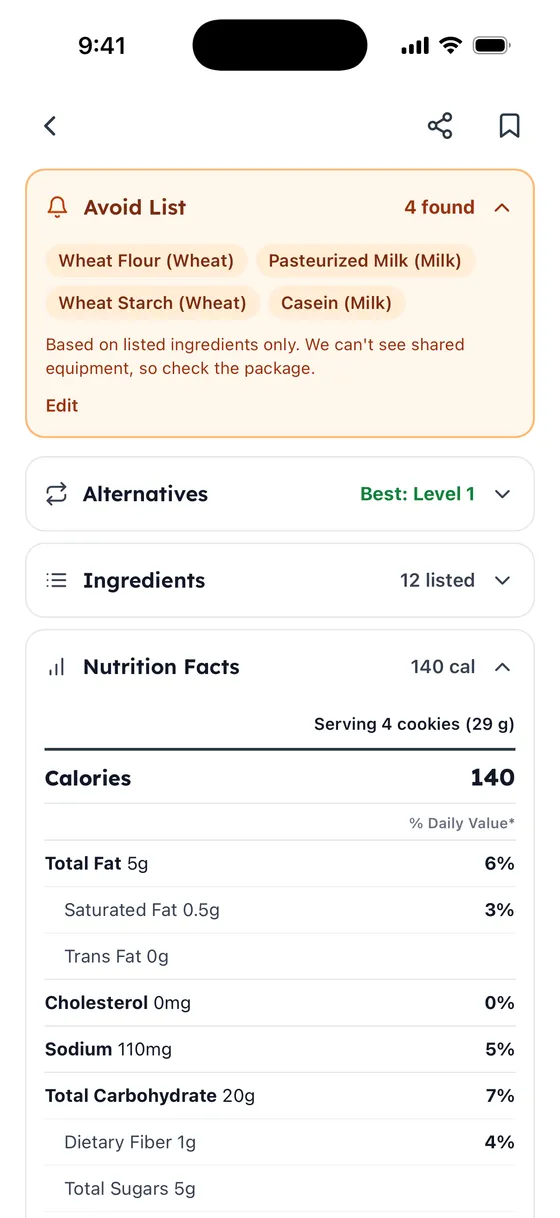
Key Takeaways
- Use both limits, not one: A PS ceiling on its own lets through minimally processed sugar, and an NS floor on its own lets through ultra-processed “health” food.
- Adjust by category: read the Good PS and Good NS columns above, which are set inside each category rather than across the whole database.
- Shop the perimeter: the categories on the store edge average PS 4.4 against 8.4 in the packaged aisles.
- Small swaps matter: switching from a flavored yogurt to plain yogurt with fruit moves both scores at once.